Package Design
Detailed Description
Title:Design Package Description:Regression modeling, testing, estimation, validation, graphics, prediction, and typesetting by storing enhanced model design attributes in the fit. Design is a collection of about 180 functions that assist and streamline modeling, especially for biostatistical and epidemiologic applications. It also contains new functions for binary and ordinal logistic regression models and the Buckley-James multiple regression model for right-censored responses, and implements penalized maximum likelihood estimation for logistic and ordinary linear models. Design works with almost any regression model, but it was especially written to work with logistic regression, Cox regression, accelerated failure time models, ordinary linear models, the Buckley-James model, and generalized least squares for serially or spatially correlated observations.
Author:Frank E Harrell Jr <f.harrell@vanderbilt.edu> Maintainer:Charles Dupont <charles.dupont@vanderbilt.edu> Version:2.0-12 Built:R 2.1.1; i486-pc-linux-gnu; 2005-09-17 00:40:36; unix Date:2005-09-15 Depends:Hmisc (>= 3.0-0), survival License:GPL version 2 or newer Packaged:Thu Sep 15 15:47:38 2005; dupontct Suggests:MASS, rpart, nlme URL:http://biostat.mc.vanderbilt.edu/s/Design, http://biostat.mc.vanderbilt.edu/rms
psm
Accelerated failure time parametric survival model

Last ouput from psm(). For all plots see PDF file.
PDF output with all plots
Example code and log output is in the "Files" section, please see: Design/psm/example.log
cph
Cox proportional hazards regression
Last ouput from cph(). For all plots see PDF file.
PDF output with all plots
Example code and log output is in the "Files" section, please see: Design/cph/example.log
bj
Buckley-James censored least squares linear model
Last ouput from bj(). For all plots see PDF file.
PDF output with all plots
Example code and log output is in the "Files" section, please see: Design/bj/example.log
robcov
Robust covariance matrix estimates
Last ouput from robcov(). For all plots see PDF file.
PDF output with all plots
Example code and log output is in the "Files" section, please see: Design/robcov/example.log
bootcov
Bootstrap covariance matrix estimates
Last ouput from bootcov(). For all plots see PDF file.
PDF output with all plots
Example code and log output is in the "Files" section, please see: Design/bootcov/example.log
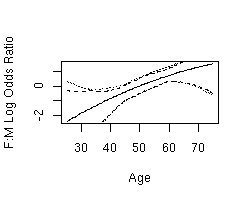
contrast
General contrasts, C.L., tests
Last ouput from contrast(). For all plots see PDF file.
PDF output with all plots
Example code and log output is in the "Files" section, please see: Design/contrast/example.log
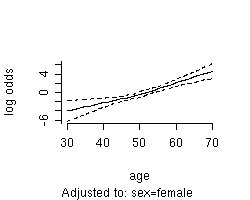
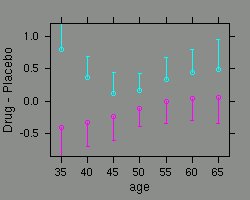
plot
Plot effects of predictors
Last ouput from plot(). For all plots see PDF file.
PDF output with all plots
Example code and log output is in the "Files" section, please see: Design/plot/example.log
sensuc
Sensitivity of one binary predictor in lrm and cph models to an unmeasured binary confounder
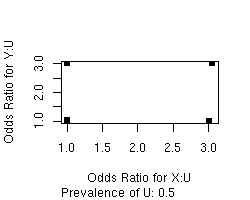
Last ouput from sensuc(). For all plots see PDF file.
PDF output with all plots
Example code and log output is in the "Files" section, please see: Design/sensuc/example.log
Hazard
S function analytic representation of a fitted hazard function (for psm)
Last ouput from Hazard(). For all plots see PDF file.
PDF output with all plots
Example code and log output is in the "Files" section, please see: Design/Hazard/example.log
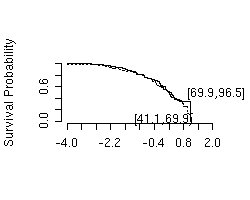
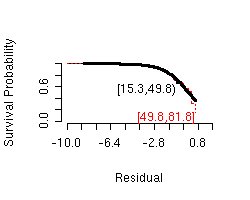
Survival
S function analytic representation of fitted survival function (for psm,cph)

Last ouput from Survival(). For all plots see PDF file.
PDF output with all plots
Example code and log output is in the "Files" section, please see: Design/Survival/example.log
nomogram
Draws a nomogram for the fitted model
Last ouput from nomogram(). For all plots see PDF file.
PDF output with all plots
Example code and log output is in the "Files" section, please see: Design/nomogram/example.log
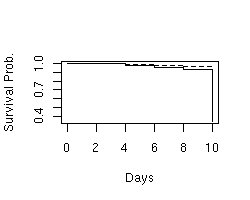
survplot
Plot survival curves (psm, cph)
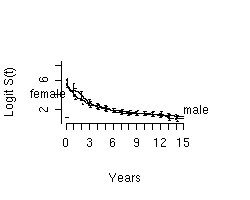
Last ouput from survplot(). For all plots see PDF file.
PDF output with all plots
Example code and log output is in the "Files" section, please see: Design/survplot/example.log
calibrate
Estimate calibration curve for model using resampling
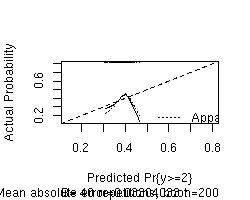
Last ouput from calibrate(). For all plots see PDF file.
PDF output with all plots
Example code and log output is in the "Files" section, please see: Design/calibrate/example.log
pentrace
Find optimum penality for penalized MLE Print effective d.f. for each type of variable in model, for penalized fit or pentrace result
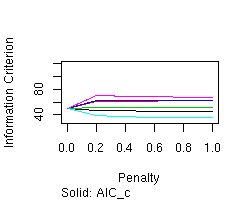
Last ouput from pentrace(). For all plots see PDF file.
PDF output with all plots
Example code and log output is in the "Files" section, please see: Design/pentrace/example.log
Generated on Fri Apr 14 15:02:05 2006 for RGraphExampleLibrary by
 1.4.6
1.4.6